Technical vs. Fundamental Analysis: How to Predict the Market in 2026
Imagine you are buying a used car. How do you decide if it is worth the price? You probably do two things:
- The Inspection: You open the hood, check the engine, look at the mileage, and read the service history. You want to know if the machine is healthy.
- The Price Check: You look at charts of similar cars sold recently. If this model usually sells for $10,000 and the dealer is asking $8,000, you know it’s a "good deal" based on the price history.
In trading, we do the exact same thing.
- Fundamental Analysis is "checking the engine" (Economic Health).
- Technical Analysis is "checking the price history" (Charts & Patterns).
Some traders swear by charts. Others only read the news. In this guide, we will break down both methods, explain which one is easier for beginners, and show you how professional traders often combine them to find the perfect trade.
1. What Is Fundamental Analysis? (The "Why")
Fundamental Analysis is the study of the underlying forces that drive the economy. It answers the question: "Why is this currency strong or weak?"
A Fundamental Analyst (let's call him "Frank") doesn't look at squiggly lines on a chart. Frank looks at the real world. He believes that if a country's economy is doing well, its currency should rise in value.
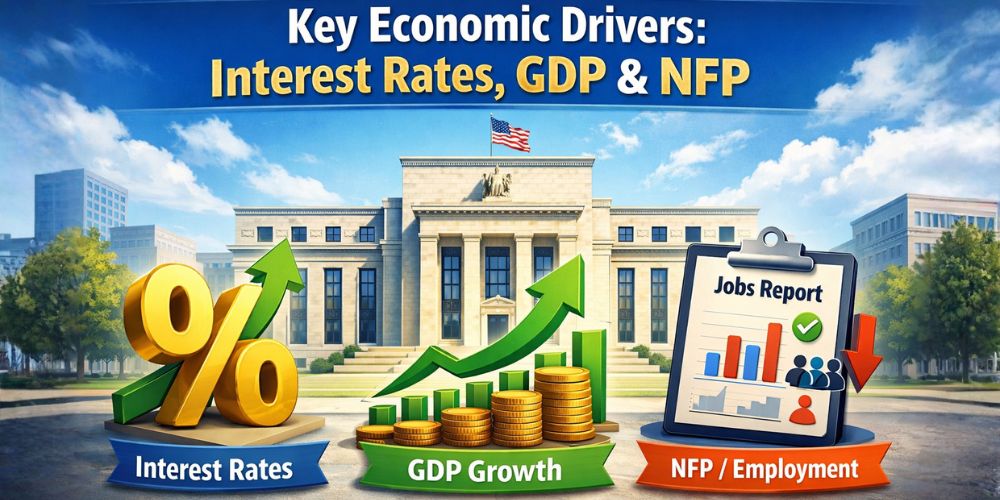
- Interest Rates: This is the most powerful driver. If the US Central Bank (The Fed) raises interest rates, investors rush to buy Dollars to earn that higher interest. The Dollar gets stronger.
- GDP (Gross Domestic Product): This measures a country's total economic output. Higher GDP = Stronger Economy = Stronger Currency.
- Unemployment Data: If more people have jobs, they spend more money. This is good for the economy. In the US, the "Non-Farm Payrolls" (NFP) report is the most watched event every month.
The Strategy: Frank reads the news. He sees that inflation in Europe is high, so he predicts the European Central Bank will raise interest rates. He buys EUR/USD before it happens, expecting the Euro to rise over the next few weeks.
Stay updated with upcoming economic events using our Economic Calendar.
2. What Is Technical Analysis? (The "When")
Technical Analysis is the study of price action and psychology. It answers the question: "When is the best time to enter the trade?"
A Technical Analyst (let's call her "Tina") believes that all the news is already "priced in." She doesn't care why the price is moving; she only cares that it is moving. She believes history repeats itself.
- Trends: "The trend is your friend." If the chart is going up (Higher Highs and Higher Lows), Tina buys. She doesn't swim against the current.
- Support & Resistance: These are invisible "floors" and "ceilings" on a chart where the price tends to bounce.
- Support: A price level where buyers step in (The Floor).
- Resistance: A price level where sellers step in (The Ceiling).
- Indicators: These are mathematical formulas applied to the chart. Examples include:
- RSI (Relative Strength Index): Tells you if the price is "Overbought" (too expensive) or "Oversold" (too cheap).
- Moving Averages: Smooths out the noise to show the average price over the last 50 or 200 days.
The Strategy: Tina sees that Gold has hit a "Resistance" level of $2,500 three times in the past and failed to break through. She places a SELL order at $2,499, betting that history will repeat and the price will fall again.
Learn more about chart patterns in our dedicated Technical Analysis Section.
3. The Comparison: Which Style Is Right for You?
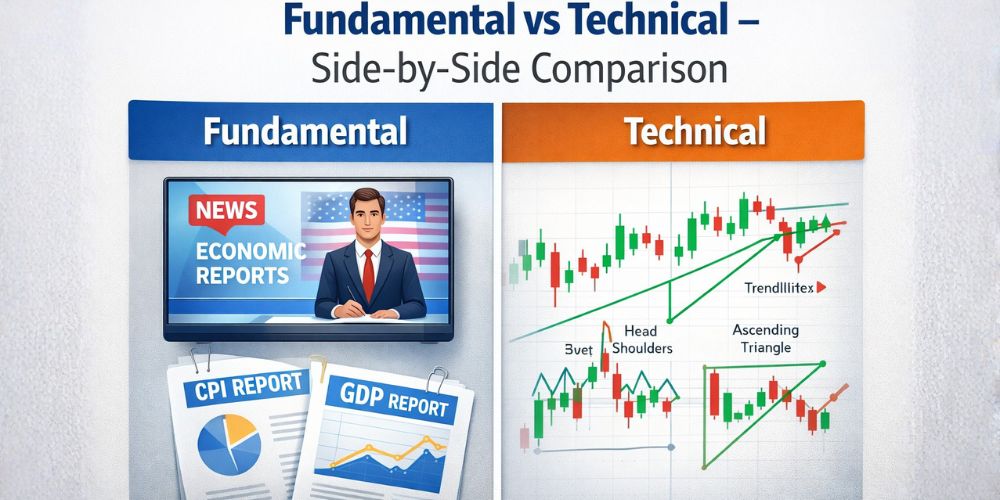
New traders often feel they have to pick a side. Are you Team Frank or Team Tina? Let's compare them.
| Feature | Fundamental Analysis | Technical Analysis |
|---|---|---|
| Focus | Economic Data & News | Price Charts & Patterns |
| Time Horizon | Long Term (Weeks/Months) | Short Term (Minutes/Days) |
| Difficulty | Harder (Requires economic knowledge) | Easier (Visual learning) |
| Best For | Investing / Position Trading | Day Trading / Scalping |
| Key Risk | Unexpected News | False Breakouts |
It is easier to learn how to read a chart than it is to understand complex global macroeconomics. You can look at a chart and instantly see "Oh, it's going up." But interpreting an inflation report requires more study.
However, relying only on charts can be dangerous. You might see a perfect "Buy" pattern on the chart, but if the US President suddenly tweets something negative about the economy, that chart pattern will fail instantly.
4. The "Hybrid" Approach: How Pros Trade
The best traders don't choose. They use both. This is often called "Techno-Fundamental" analysis. Here is how a Pro Trader operates:
The trader checks the Economic Calendar and reads the Market News.
- Observation: "The US economy is weak, and the Japanese Yen is strong."
- Decision: "I am only looking to SELL USD/JPY." (They ignore any buy signals).
Now that they know what to do (Sell), they switch to the charts to find exactly where to enter.
- Observation: "The price is currently high, hitting a Resistance level, and the RSI indicator says it is Overbought."
- Action: "I will enter the Sell trade NOW."
Why this works: Fundamentals give you the Direction. Technicals give you the Entry Price. If you have the right direction but the wrong timing, you can lose money. If you have the right timing but the wrong direction, you are fighting the tide. You need both.
5. A Simple Technical Strategy for Beginners: "The Bounce"
If you want to start practicing Technical Analysis today, try this simple strategy on your Demo Account.
- Open a chart (e.g., EUR/USD).
- Look for a price level where the market has bounced UP at least twice before.
- Draw a horizontal line there. This is your Support.
- Wait for the price to come back down to this line.
- The Trade: When it touches the line, BUY.
- The Protection: Place your Stop Loss just below the line (in case it breaks).
- The Target: Place your Take Profit at the next high point.
This strategy relies on the psychology that "buyers remember where they bought cheap last time."
6. Where to Find Analysis Tools
You don't need expensive software to do this. JaazMarkets provides everything you need for free.
- For Fundamentals: Check our News Section daily. Before you trade, check the Calendar to make sure no big announcements are about to happen.
- For Technicals: Our Web Trader comes with over 50 built-in indicators and drawing tools. You can draw lines, add Fibonacci levels, and analyze trends directly in your browser.
Conclusion: Don't Trade Blind
Trading without analysis is just gambling. If you are flipping a coin to decide whether to Buy or Sell, you will eventually lose your money.
- Fundamental Analysis tells you the Health of the market.
- Technical Analysis tells you the Mood of the market.
To be a complete trader, you should respect both. Start by learning the basics of charts (Technicals), but always keep one eye on the news (Fundamentals).
- Open your Demo Account.
- Open the chart for Gold (XAU/USD).
- Switch the timeframe to Daily (D1).
- Can you see the trend? Is it going up or down?
- Now, check the News. Is there any reason why it is moving that way?
Trying to connect the "Chart" with the "News" is your first step toward trading mastery.