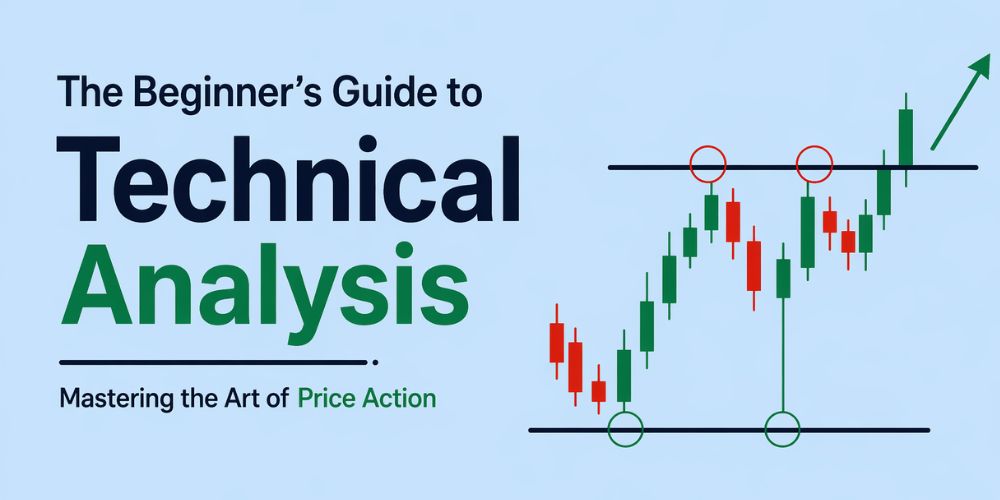
The Beginner’s Guide to Technical Analysis: Mastering the Art of Price Action
Category: Trading Tools & Analysis
the fast-paced world of financial markets, traders are often divided into two camps: those who follow the "why" (Fundamental Analysis) and those who follow the "what" (Technical Analysis). For users at Jaaz Markets, understanding the latter is not just an advantage, it is a necessity. Technical analysis is the language of the market. It is the study of collective human psychology, distilled into visual patterns and mathematical data.
While fundamental analysis looks at financial statements, interest rates and geopolitical events to determine a "fair value," technical analysis operates on the belief that price is truth. Everything you need to know about a pair like EUR/USD or a commodity like Gold is already reflected in the price on your screen. This blog will walk you through the core pillars of technical analysis, from the philosophy behind it to the advanced indicators used by professional traders globally.
The Three Pillars of Technical Analysis
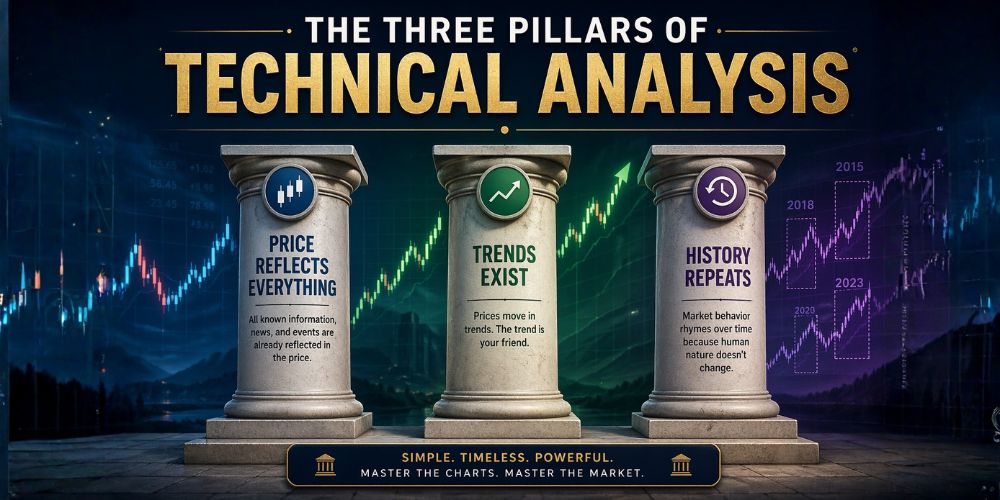
Before we dive into the charts, we must understand the "laws" that govern this discipline. These were largely popularized by Charles Dow, the father of modern technical analysis.
A. The Market Discounts Everything
This is the most critical concept. Technical analysts believe that all factors past, present and even future expectations are already baked into the current price. Whether it’s an upcoming Federal Reserve meeting or a sudden supply chain disruption, the price movement on your chart is the market's collective reaction to that information. Therefore, you don't need to be a macroeconomics expert to trade; you just need to read the tape.
B. Price Moves in Trends
The market is rarely stagnant. It moves in waves. A fundamental law of physics applies here: an object in motion tends to stay in motion. In trading, a trend is more likely to continue than to reverse. Technical analysis aims to identify these trends early and ride them until the signals suggest a change in direction.
C. History Tends to Repeat Itself
Human nature doesn't change. Fear, greed, and hope have driven market participants for centuries. Because humans react to similar situations in similar ways, specific patterns emerge on charts. These patterns happened in 1920, they happened in 2020, and they will happen tomorrow.
Reading the Canvas: Japanese Candlesticks
To perform technical analysis, you need a way to visualize price. While line charts show the closing price, Japanese Candlesticks provide a much deeper story.
Each candlestick tells you four pieces of information: the Open, High, Low, and Close (OHLC) for a specific timeframe.
- The Body: The thick part of the candle. If the close is higher than the open, it's a Bullish (Green/White) candle. If the close is lower, it’s a Bearish (Red/Black) candle.
- The Wicks (Shadows): The thin lines sticking out of the top and bottom. The top wick represents the highest price reached during that period, and the bottom wick represents the lowest.
When you see a candle with a very long bottom wick and a small body at the top, it tells you that sellers tried to push the price down, but buyers stepped in aggressively to push it back up. This single candle provides a clue about market sentiment that a simple line chart would miss.
Support and Resistance: The Floor and the Ceiling
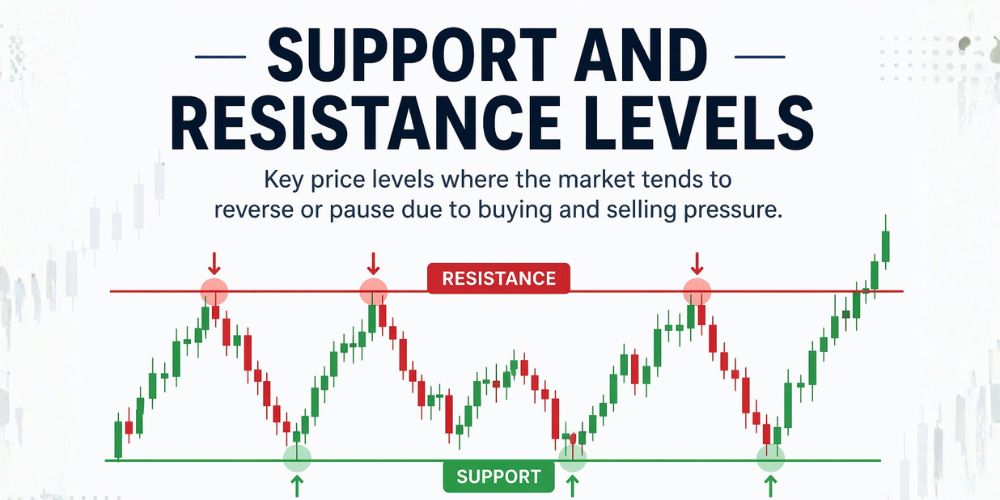
If you master nothing else, master Support and Resistance. These are the horizontal levels where the price has historically struggled to pass through.
Support (The Floor)
Support is a price level where a downtrend tends to pause due to a concentration of buying demand. Think of it as a floor that prevents the price from falling further. As the price drops toward support, buyers see a "bargain" and enter the market, while sellers hesitate to sell lower.
Resistance (The Ceiling)
Resistance is the opposite. It is a level where an uptrend pauses because selling interest overcomes buying pressure. It acts as a ceiling. When price hits resistance, traders who bought lower start taking profits, and new "short" sellers enter, expecting the price to drop.
The Role Reversal: One of the most powerful concepts in technical analysis is that broken resistance becomes new support, and broken support becomes new resistance. When the price finally breaks through a "ceiling," that level often becomes the new "floor" as the market moves higher.
Trend Identification: The Trader’s Best Friend
"The trend is your friend until the end when it bends." This old trading adage is the secret to consistency. There are three types of market environments:
- Uptrend: A series of Higher Highs (HH) and Higher Lows (HL). You should primarily look for buying opportunities here.
- Downtrend: A series of Lower Highs (LH) and Lower Lows (LL). You should primarily look for selling opportunities here.
- Sideways/Ranging: The price moves between a clear support and resistance zone without a clear direction.
Trendlines are used to visualize these moves. By connecting the lows in an uptrend or the highs in a downtrend, you create a diagonal boundary. If the price breaks this line, it is often the first warning sign that the trend is dying.
Technical Indicators: The Math Behind the Move
Indicators are mathematical calculations applied to price and volume to help traders filter noise and find high-probability setups. We categorize them into two main groups:
A. Trend Indicators (Lagging)
These tell you what the market is doing right now.
- Moving Averages (MA): These smooth out price action by averaging prices over a set number of days (e.g., the 50-day or 200-day MA). When the price is above the moving average, the trend is considered bullish.
- Bollinger Bands: These consist of a middle moving average and two outer bands that represent volatility. When the bands "squeeze" together, it often precedes a massive price breakout.
B. Oscillators (Leading)
These help predict when a trend might be exhausted.
- Relative Strength Index (RSI): This measures the speed and change of price movements. It scales from 0 to 100. Traditionally, an RSI above 70 suggests the market is "Overbought" (due for a drop), while an RSI below 30 suggests it is "Oversold" (due for a bounce).
- MACD (Moving Average Convergence Divergence): This shows the relationship between two moving averages. When the MACD line crosses above the signal line, it’s a bullish signal.
Chart Patterns: Geometric Predictions
Patterns are specific shapes that appear on the charts, signaling a potential move.
Reversal Patterns:
- Head and Shoulders: This looks like a peak (shoulder), followed by a higher peak (head), and another lower peak (shoulder). It signals that an uptrend is reversing into a downtrend.
- Double Top/Bottom: When price hits a level twice and fails to break through, it suggests the market has "run out of steam."
Continuation Patterns:
- Flags and Pennants: These look like a sharp price move (the flagpole) followed by a small rectangular or triangular consolidation (the flag). It usually suggests the price is "taking a breather" before continuing its original move.
The Importance of Volume
Volume is the "fuel" for the market. It represents the total number of units traded.
- If the price is rising and volume is increasing, the trend is strong.
- If the price is rising but volume is decreasing, the trend is weak and likely to fail soon. Always look for high volume to confirm a breakout from a support or resistance level.
Risk Management: The Survival Strategy
You can be the best technical analyst in the world, but without risk management, you will eventually lose your capital. Professional traders at Jaaz Markets follow strict rules:
- Stop-Loss Orders: Always set a price at which you will admit you are wrong and exit the trade. This prevents a small loss from becoming a catastrophic one.
- Risk-to-Reward Ratio: Aim for at least a 1:2 ratio. This means for every $1 you risk, you aim to make $2. With this ratio, you can be wrong 50% of the time and still be profitable.
- Emotional Discipline: Technical analysis is objective, but humans are subjective. Stick to your plan and don't let fear or greed change your strategy mid-trade. Review our Risk Disclosure.
Final Thoughts for Beginners
Technical analysis is not a crystal ball. It is a game of probabilities. By combining support/resistance, trendlines, and indicators, you create a "trading edge."
For those starting their journey with Jaaz Markets, the best way to learn is through observation. Open a Demo Account, identify the trend, draw your support levels, and see how the market reacts. Over time, the "noise" of the candles will turn into a clear, navigable story. You can use our Web Trader or Mobile App to practice.
Happy Trading!
Are you ready to apply these concepts on a live chart, or should we break down a specific indicator like the RSI in more detail? Explore more at our Academy or check our Trading Conditions. For any queries, visit our Contact Page or read the FAQ.