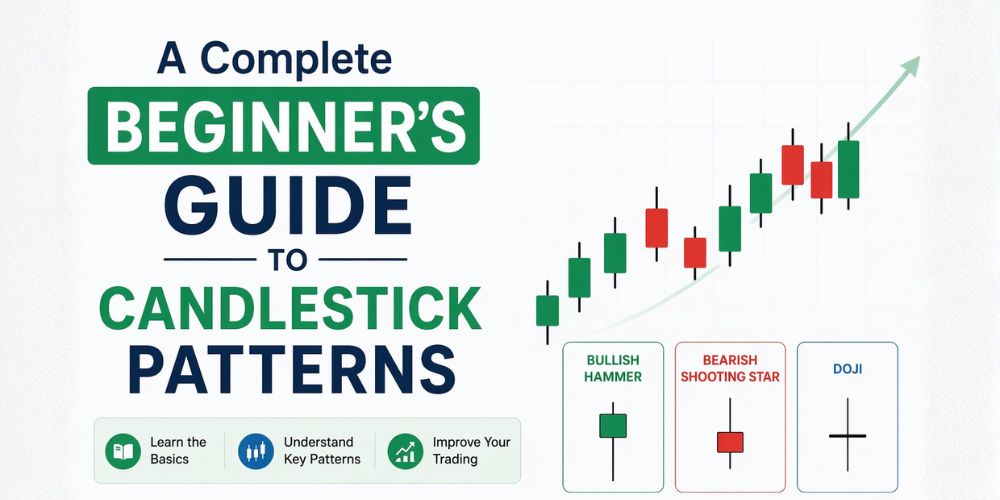
A Complete Beginner’s Guide to Candlestick Patterns
Category: Academy / Technical Analysis
If you have ever opened a trading terminal at Jaaz Markets, you were likely met with a sea of red and green bars jumping across your screen. To the untrained eye, these look like random fluctuations. But to a professional trader, these are Japanese Candlesticks and they are telling a detailed story about who is winning the war: the buyers (Bulls) or the sellers (Bears).
Understanding candlestick patterns and price action is arguably the most important skill in technical analysis. While a simple line chart only tells you the "closing price," a candlestick reveals the emotion, the indecision and the sudden shifts in power that happen within every minute of the trading day.
In this comprehensive guide, we will break down everything from the basic anatomy of a candle to the top patterns every trader should know to predict market reversals.
The History and Anatomy of a Candlestick
Japanese candlesticks date back to the 1700s, originally used by Japanese rice traders to track market momentum. They realized that while there was a link between the price and the supply and demand of rice, the markets were also heavily influenced by the emotions of the traders.
The Four Data Points
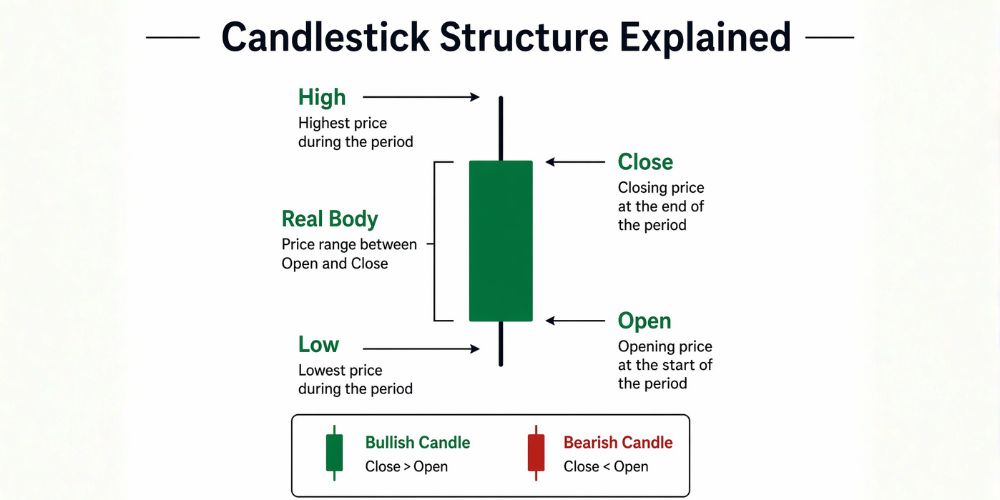
Every single candle represents a specific period (for example, 1 hour or 1 day) and provides four key pieces of information:
- Open: The price at which the period started.
- High: The highest price reached during the period.
- Low: The lowest price reached during the period.
- Close: The price at which the period ended.
Real Body vs. Wicks
- The Real Body: This is the thick, colored part of the candle. It shows the range between the open and the close. If the body is Green, the price closed higher than it opened (Bullish). If it is Red, the price closed lower (Bearish).
- The Wicks (Shadows): The thin lines above and below the body. They represent the "extremes" of the session. A long upper wick tells us that buyers tried to push the price high, but failed. A long lower wick tells us that sellers tried to crash the price, but buyers fought back.
Single Candlestick Patterns: The First Signals
Sometimes, one single candle is enough to signal that a trend is about to end. These are often the easiest to spot on the Jaaz Markets platform.
A. The Hammer (Bullish Reversal)
The Hammer has a small body at the top and a very long lower wick. It appears at the bottom of a downtrend.
B. The Shooting Star (Bearish Reversal)
The Shooting Star is the "evil twin" of the Hammer. It has a small body at the bottom and a long upper wick. It appears at the top of an uptrend.
How to Trade Candlesticks Like a Professional
One of the biggest mistakes beginners at Jaaz Markets make is trading candlestick patterns in isolation. If you see a Hammer in the middle of a random sideways move, it means nothing.
To be successful, you must use Confluence. This involves combining candles with other tools like the RSI indicator to confirm overbought or oversold conditions.
Rule 1: Location is Everything
A bullish pattern (like a Hammer) is only valuable if it occurs at a Support level. A bearish pattern (like a Shooting Star) is only valuable if it occurs at a Resistance level. Read our Support and Resistance trading guide for practical examples.
Rule 2: Size Matters
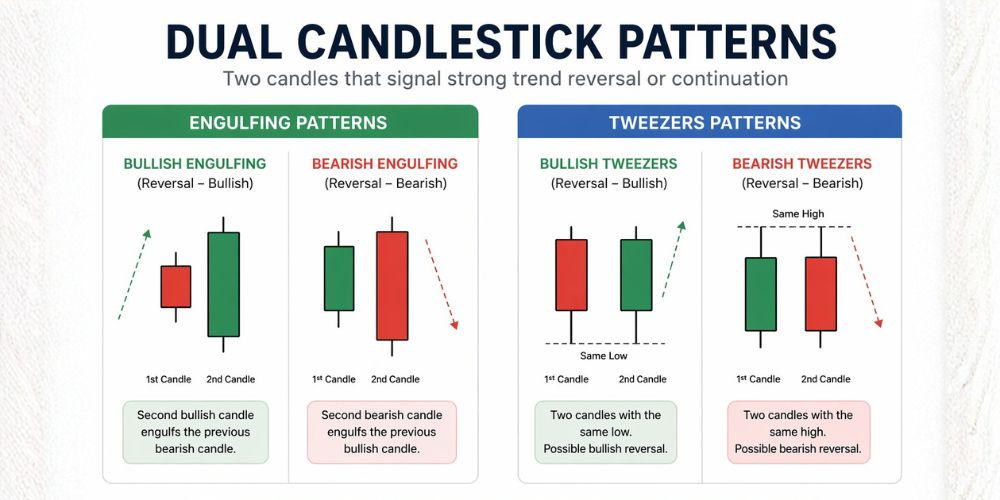
The larger the candle, the more significant the move. A tiny "Engulfing" candle isn't as meaningful as a massive one that stands out from the rest of the chart.
Rule 3: Wait for the Close
This is the most important rule. A candle can look like a perfect Hammer with 1 minute left on the clock, but in those final 60 seconds, it could turn into a giant red bearish candle. Never enter a trade until the candle has officially closed.
Summary: Why Candlesticks are Your Best Friend
Candlestick patterns are the ultimate visual tool for traders. They bridge the gap between "data" and "psychology." By learning these patterns, you are no longer just looking at numbers; you are looking at the hopes, fears and decisions of millions of traders around the world.
At Jaaz Markets, we provide high-quality charting tools that allow you to customize your candles and identify these patterns with ease.
Your Action Plan:
- Open a demo account on Jaaz Markets.
- Find a major Support level.
- Wait for a Bullish Candlestick pattern to form at that level.
- Observe what happens next.
Once you see these patterns work in real-time, you will never look at a price chart the same way again.
👉 Start Learning more at our Academy or contact us via our Contact Page if you have questions. Explore our Mobile App for real-time data.