Support and Resistance Explained: The Ultimate Guide for Beginners
Category: Academy / Trading Education
In the world of trading, whether you are dealing with Forex, Gold or Stocks, there is one concept that stands above all others. It is the foundation upon which almost every successful trading strategy is built. If you can master this, you can understand the "language" of the market.This concept is Support and Resistance.
At Jaaz Markets, we believe that trading doesn't have to be complicated. You don't need a PhD in economics to be a profitable trader; you just need to understand how the "floor" and the "ceiling" of the market work.
What are Support and Resistance?
Imagine you are in a house bouncing a tennis ball.
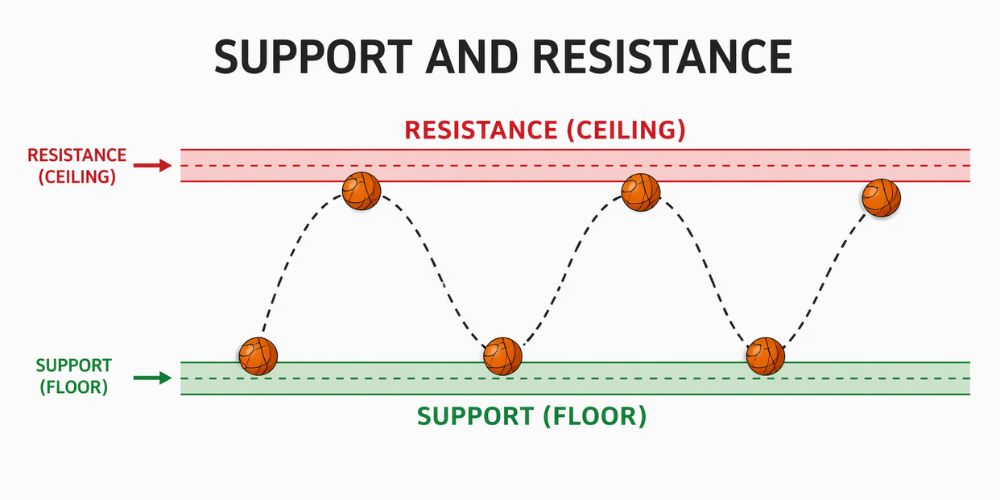
- When you throw the ball down, it hits the floor and bounces back up.
- When you throw the ball up, it hits the ceiling and falls back down.
In trading, price behaves exactly like that tennis ball.
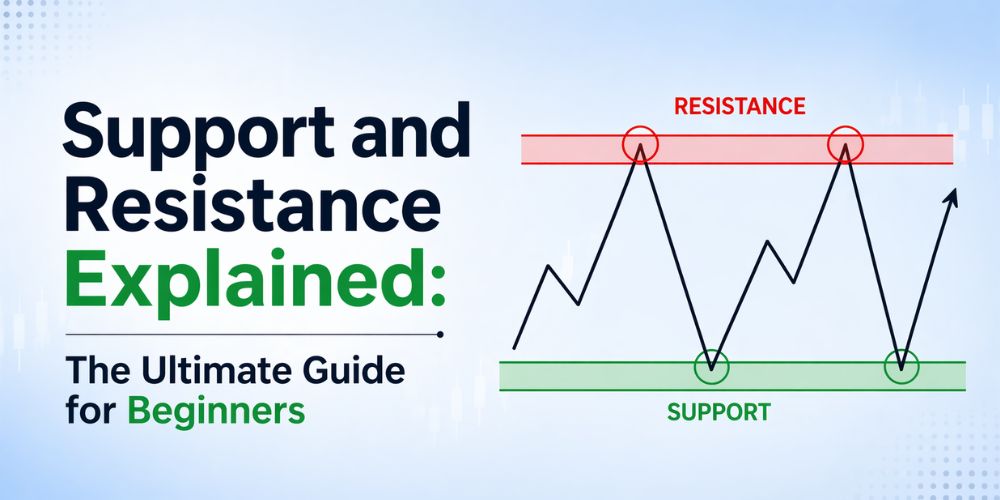
1. Support (The Floor)
Support is a price level where a downtrend tends to pause. When the price of an asset (like EUR/USD) falls, it eventually hits a level where buyers think, "This is a great price to buy!" As more people start buying at that low price, the falling stops and the price "bounces" back up. Support is a zone where buying power is stronger than selling power.
2. Resistance (The Ceiling)
Resistance is the opposite. It is a price level where an uptrend tends to pause. As the price goes higher and higher, it eventually hits a level where traders who bought lower think, "This price is high enough, I’m going to sell and take my profit." As more people sell, the upward movement stops and the price falls back down. Resistance is a zone where selling power is stronger than buying power.
Why Do These Levels Exist? (The Psychology)
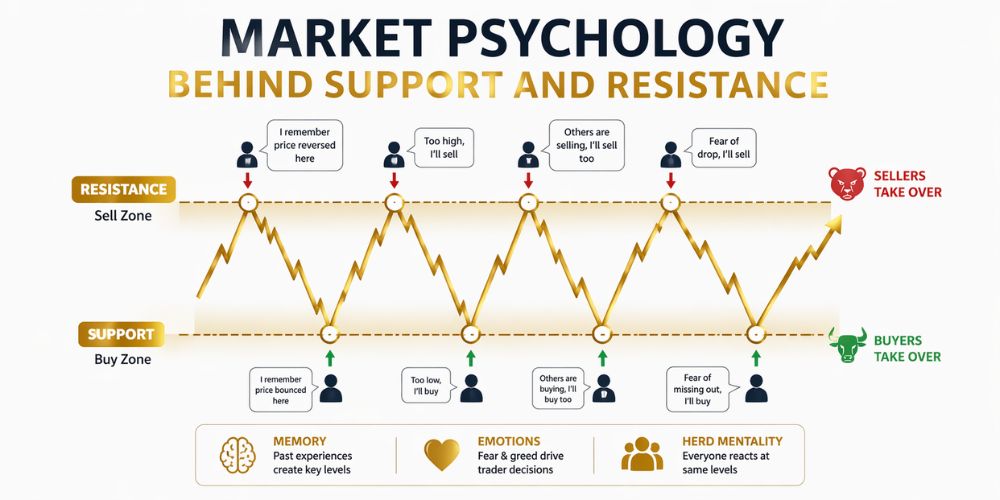
To understand support and resistance, you have to understand human psychology. The market is made of people, and people have memories.
The Power of Memory
Imagine the price of Gold is at $2,000. It falls to $1,900 and then suddenly shoots back up to $2,100.
- The Buyers: The people who bought at $1,900 are happy. They wish they had bought more.
- The Waiters: The people who missed the trade are waiting for the price to come back to $1,900 so they can buy this time.
- The Sellers: The people who sold at $1,900 (expecting it to go lower) are now in a loss. They are praying for the price to return to $1,900 so they can exit their trade without losing money.
Because everyone is looking at that $1,900 level, when the price eventually falls back there, a massive amount of buying happens. That is how a Support level is created.
Real-Life Examples of Support and Resistance
Let’s look at how this actually looks on the charts you see at Jaaz Markets.
Example 1: Horizontal Support (The Triple Bottom)
Imagine you are looking at the USD/JPY chart. You notice that every time the price touches 140.00, it bounces back up. It happened in January, it happened in March, and it just happened again in June. This is a Horizontal Support. The more times the price touches this level and bounces, the "stronger" the support becomes.
Example 2: Horizontal Resistance (The Ceiling)
Look at Bitcoin. For a long time, it struggled to get past $70,000. Every time it reached $69,800 or $70,000, it would drop sharply. Sellers were sitting at that "ceiling" waiting to push the price down. This is a Horizontal Resistance.
Example 3: Trendline Support (The Moving Floor)
Support doesn't always have to be a straight horizontal line. In a strong uptrend, the market moves in a "staircase" pattern. If you draw a diagonal line connecting the Lows of the price, you get a Trendline Support. As long as the price stays above this diagonal line, the trend is healthy.
The Golden Rule: Role Reversal
This is the most important part of this guide. Once a level is broken, it changes its personality.
- When Support is broken, it often becomes the new Resistance.
- When Resistance is broken, it often becomes the new Support.
Why? Imagine a "ceiling" (Resistance) that has held the price down four times. Finally, the price breaks through it and goes much higher. Now, the traders who sold at that ceiling realize they were wrong. They wait for the price to come back down to that level to "buy" and cover their mistakes. This turns the old ceiling into a new floor.
How to Identify These Levels Like a Pro
Now that you know what they are, how do you find them? Here are three simple steps:
Step 1: Look for the "V" and "A" Shapes
Look at your chart. Wherever you see a sharp "V" shape, that is a Support point. Wherever you see a sharp "A" (inverted V) shape, that is a Resistance point. Connect these points with a horizontal line.
Step 2: Use Higher Timeframes
If you find a support level on a 5-minute chart, it might not be very strong. But if you find a support level on a Daily (D1) or 4-Hour (H4) chart, that level is like a wall of granite. Large banks and institutional traders look at these higher timeframes. Review our Trading Conditions for more on market execution.
Step 3: Look for "Clutter"
Find areas where the price seems to have "stuck" for a long time. These sideways zones usually turn into major support or resistance levels in the future.
Using Indicators to Find Support and Resistance
While drawing lines is the best way, you can also use technical tools available on the Jaaz Markets platform to help you.
1. Moving Averages
A Moving Average (like the 50-day or 200-day MA) acts as a Dynamic Support or Resistance. In an uptrend, the price often falls down to touch the Moving Average line and then bounces off it.
2. Psychological Numbers (Round Numbers)
Humans love round numbers. Levels like 1.1000 in Forex, $100 in Stocks, or $2,500 in Gold naturally act as support or resistance because people place their orders at these "clean" numbers. You can check these levels using our Calculators.
Common Mistakes Beginners Make
Even though support and resistance are simple, many beginners lose money because of these three mistakes:
- Thinking it’s a single price: Support and resistance are not exact lines; they are Zones. Price might go a few pips past your line before bouncing. Always think of it as a "buffer zone" rather than a thin wire. Refer to our Glossary for terms like 'Slippage'.
- Trading "False Breakouts": Sometimes the price breaks through a resistance level, making everyone think it's going to the moon. Then, it suddenly crashes back down. This is a "Bull Trap." To avoid this, always wait for a candle to close above the level before entering.
- Ignoring the Trend: Never try to buy at support when the market is in a massive crash (downtrend). It’s like trying to catch a falling knife. Wait for the price to actually show signs of bouncing before you jump in. See our Top 5 Trading Mistakes guide.
How to Trade Using Support and Resistance
Here is a simple strategy you can use on Jaaz Markets today:
- Find the Level: Identify a strong support zone on the H4 chart.
- Wait for the Touch: Wait for the price to come down and touch that zone.
- Look for Confirmation: Don't just buy blindly. Look for a "Bullish Pin Bar"(a candle with a long bottom tail) or a "Green Candle" that closes higher.
- Set Your Stop-Loss: Place your stop-loss just below the support zone. If the "floor" breaks, you want to get out immediately.
- Set Your Target: Look for the next Resistance level (the ceiling) and set your profit target there.
Summary: Your Path to Trading Success
Support and Resistance are the most "honest" tools in trading. They show you exactly where the battle between buyers and sellers is happening.
- Support is where buyers win.
- Resistance is where sellers win.
- Breakouts happen when one side finally gives up.
By learning to spot these levels, you stop gambling and start trading with a plan. You will know exactly where to enter, where to exit and most importantly where you are wrong. Please review our Risk Disclosure to understand the risks involved.
At Jaaz Markets, we provide you with all the charting tools you need to draw these levels accurately. Start practicing today on a demo account. Look for the floors, look for the ceilings, and watch how the market respects these invisible boundaries.
Trading is a journey of a thousand pips and every single one of them starts with Support and Resistance.
Ready to explore? Visit our Web Trader or download the Mobile App for real-time data. If you have any questions, visit our Contact Page or check our FAQ.