The Power of RSI: How to Master Momentum at Jaaz Markets (2026)
Category: Trading Education / Technical Analysis
In the world of technical analysis, traders are always looking for a way to measure the "speed" and "strength" of a price move. If a currency pair like GBP/USD is rising, is it rising because of sustainable buying, or is it "exhausted" and ready to crash? To answer this, professional traders at Jaaz Markets turn to one of the most powerful tools in their arsenal: the Relative Strength Index or RSI.
The RSI is a momentum oscillator that measures the magnitude of recent price changes to evaluate overbought or oversold conditions in the price of a stock, forex pair or commodity. Developed by J. Welles Wilder Jr. in 1978, it has remained a staple for nearly five decades because of its incredible ability to signal potential trend reversals. For a deeper dive, check out our RSI indicator trading guide for beginners.
In this blog, Jaaz Markets will break down the RSI from scratch covering how it works, how to read it, and the advanced strategies you can use to gain an edge in the markets.
Understanding the Basics of RSI
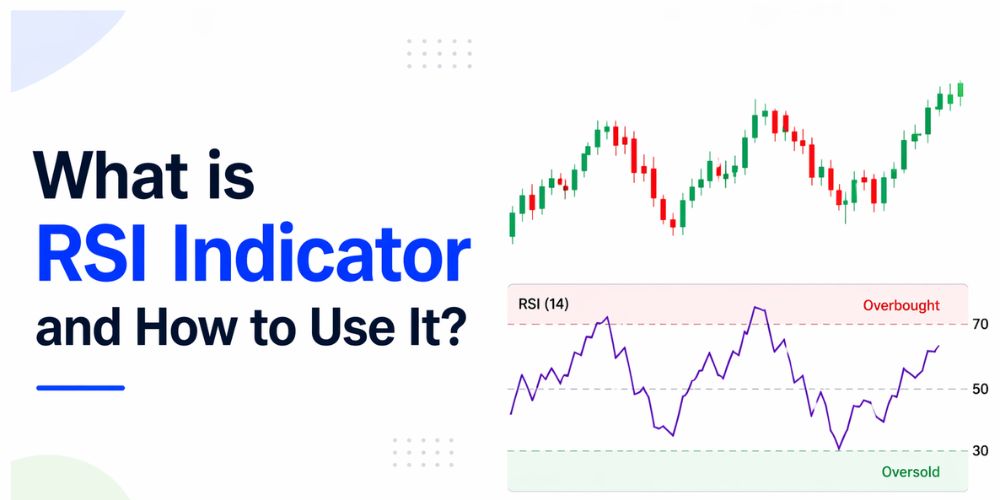
The RSI is displayed as a line graph that moves (oscillates) between two extremes: 0 and 100. Unlike a moving average that sits on top of your price candles, the RSI usually sits in a separate window at the bottom of your chart.
The Standard Settings
- Period: The default setting for RSI is 14 periods. This means if you are on a daily chart, it calculates the strength based on the last 14 days. If you are on a 1-hour chart, it uses the last 14 hours.
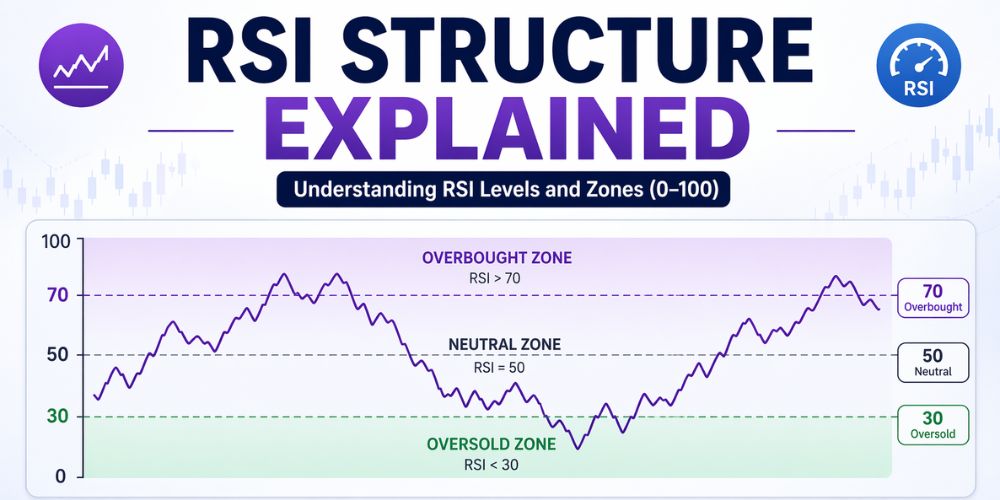
- The Upper Line (70): Traditionally, an RSI reading above 70 indicates that an asset is becoming Overbought.
- The Lower Line (30): An RSI reading below 30 indicates that an asset is becoming Oversold.
- The Center Line (50): This is the "neutral" zone. An RSI above 50 suggests bullish momentum, while below 50 suggests bearish momentum.
Overbought vs. Oversold: The Traditional Approach
The most common way beginners use the RSI is to identify when the market has gone "too far" in one direction.
Overbought (Above 70)
When the RSI climbs above 70, it suggests that the buying pressure has been very intense for a long period. The asset might be overvalued in the short term. At this point, traders start looking for signs of a price drop or a "pullback." It’s like a rubber band that has been stretched too far; eventually, it has to snap back.
Oversold (Below 30)
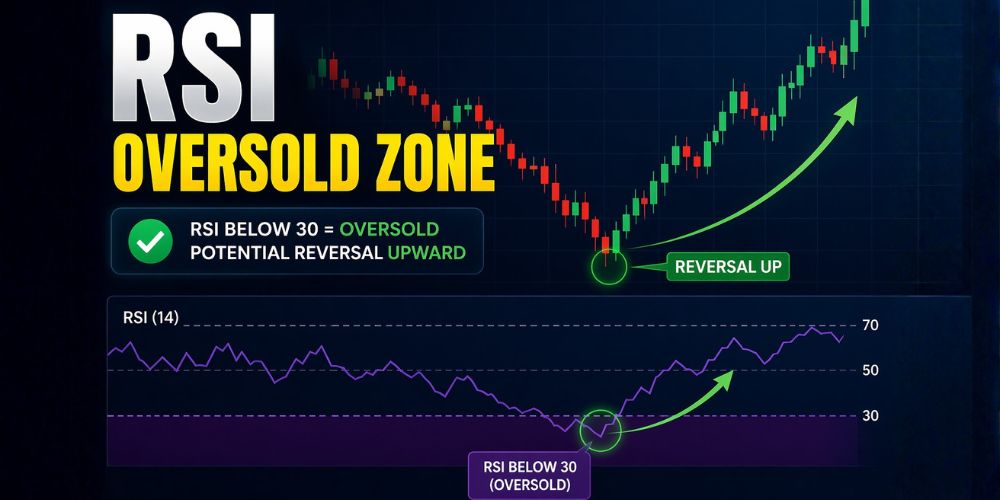
When the RSI falls below 30, it suggests that sellers have been dominant and the price has dropped sharply. This often indicates that the asset is "cheap" or undervalued relative to its recent history. Traders look for the RSI to cross back above 30 as a signal to Buy.
The Secret Weapon: RSI Divergence
While overbought and oversold levels are great, the real "pro" way to use the RSI is by spotting Divergence. Divergence occurs when the price of the asset is moving in the opposite direction of the RSI indicator. This is one of the most reliable reversal signals in all of technical analysis.
A. Bullish Divergence
- Price: Makes a "Lower Low" (the second dip is deeper than the first).
- RSI: Makes a "Higher Low" (the second dip is shallower than the first).
- Meaning: Even though the price is falling, the "momentum" of the sellers is actually weakening. This is a massive hint that a bullish reversal is about to happen.
B. Bearish Divergence
- Price: Makes a "Higher High" (the second peak is higher).
- RSI: Makes a "Lower High" (the second peak is lower).
- Meaning: The price is rising, but the buyers are losing their strength. The RSI is "diverging" from the price, signaling that the uptrend is a "fake-out" and a crash might be coming.
RSI for Trend Identification
Many traders forget that the 50-level on the RSI is a powerful trend indicator. Instead of just looking for reversals, you can use the RSI to confirm the current trend.
- In an Uptrend: The RSI tends to stay between 40 and 90. During a healthy uptrend, the 40–50 zone acts as a "support" for the RSI. If the price pulls back and the RSI bounces off the 40 level, it’s a high-probability "Buy the Dip" opportunity.
- In a Downtrend: The RSI tends to stay between 10 and 60. In this case, the 50–60 zone acts as "resistance" for the RSI. If the price bounces up but the RSI fails to break above 60, it’s a signal to "Sell the Rally."
Advanced RSI Strategy: The RSI Breakout
Did you know you can draw Trendlines and Support/Resistance levels directly on the RSI indicator itself? Understanding how to identify support and resistance on price charts can also help you apply these concepts to your indicators.
Sometimes, the RSI will break a trendline before the price does. If you see the RSI break out of a descending trendline while the price is still struggling, the RSI is giving you a "leading signal" that a price breakout is imminent. This gives you the chance to enter the trade at Jaaz Markets before the rest of the crowd catches on.
Common Pitfalls and How to Avoid Them
The RSI is brilliant, but it is not a crystal ball. Here is how beginners get trapped:
- Trading Against Strong Trends: In a massive bull market, the RSI can stay at 85 for weeks. If you keep "selling" because it’s overbought, you will lose your account. Solution: Only trade overbought signals if the overall trend is sideways or bearish. Review our Risk Disclosure.
- Wrong Timeframes: RSI on a 1-minute chart is extremely noisy. Solution: Use the 1-hour (H1) or 4-hour (H4) charts for the most reliable RSI readings.
- Ignoring Market Context: Indicators don't know about the news. If a major report is coming out, check our Economic Calendar to avoid sudden volatility.
Step-by-Step Guide: Your First RSI Trade on Jaaz Markets
Ready to put this into practice? Here is a simple checklist for your next trade:
- Identify the Trend: Is the market moving up, down, or sideways? Check Trading Hours.
- Locate Support/Resistance: Draw your horizontal lines on the price chart.
- Check the RSI:
- If the price is at Support and RSI is below 30 (Oversold), get ready.
- If the price is at Resistance and RSI is above 70 (Overbought), get ready.
- Look for Confluence: Wait for a Bullish Candlestick to form while the RSI is oversold. Check Trading Conditions.
- Enter the Trade: Set your Stop-Loss and Take-Profit according to your plan.
Customizing Your RSI
While 14 is the standard period, some traders experiment with different settings:
- 9-Period RSI: Makes the indicator more sensitive. Good for short-term stocks or scalping.
- 25-Period RSI: Makes the indicator smoother. Good for long-term investors.
For beginners, we highly recommend sticking with the 14-period setting until you are comfortable reading the waves using our Web Trader.
Conclusion: Why RSI is Essential
The Relative Strength Index is more than just a line on a chart. It is a mathematical representation of the tug-of-war between buyers and sellers. It tells you when the market is "exhausted," when a trend is gaining strength, and when a reversal is hidden in plain sight through divergence.
At Jaaz Markets, we provide a professional-grade trading environment where you can overlay the RSI on any asset class, including Metals or Crypto. Whether you are trading Gold or the steady trends of the EUR/USD, the RSI will help you trade with precision.
Remember: No indicator works 100% of the time. The secret to professional trading is combining the RSI with Price Action and Risk Management.
Quick Checklist for RSI Success:
- Above 70: Overbought (Look to Sell).
- Below 30: Oversold (Look to Buy).
- Above 50: Bullish Momentum.
- Below 50: Bearish Momentum.
- Divergence: The most powerful reversal signal.
Ready to see it live?
Open your Demo Account. Watch the Bid and Ask prices on the screen. You can also explore our Mobile App for real-time data.
👉 Start Learning more at our Academy or contact us via our Contact Page if you have questions or want to become one of our Partners.
Check our FAQ for more details on trading tools like Calculators and Glossary terms.