Top 5 Candlestick Patterns Every Trader Should Know
In our previous guides at Jaaz Markets, we explored the basic anatomy of a candlestick and the general philosophy of technical analysis. But for many traders, the real challenge begins when they open a live chart. With hundreds of patterns to choose from, which ones actually work? Which ones should you stake your capital on?
You don’t need to be a walking encyclopedia of chart shapes to be successful. In fact, most professional traders rely on a small handful of high-probability setups. By mastering just these Top 5 Candlestick Patterns, you can strip away the noise and focus on the signals that truly move the market.
1. The Hammer (The Ultimate Bottom Signal)
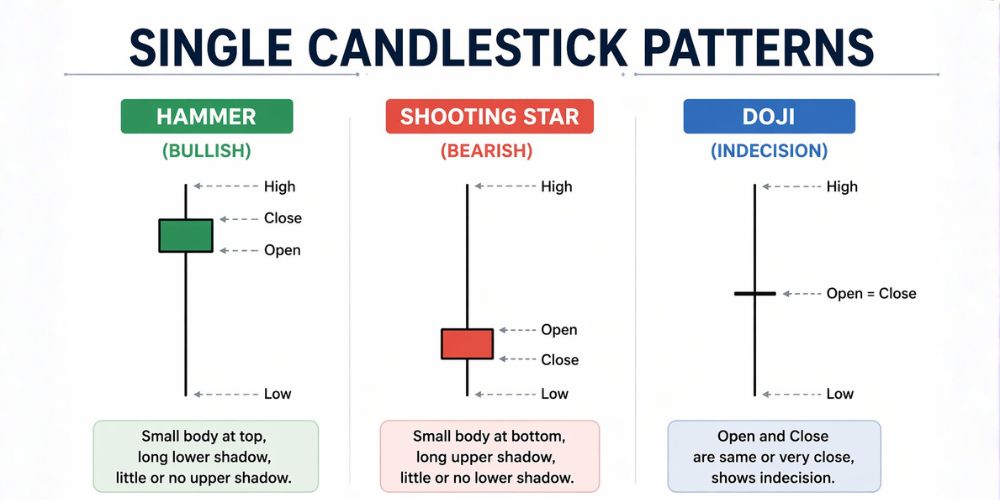
The Hammer is perhaps the most famous bullish reversal pattern in the world of trading. It is easy to identify and carries a very high success rate when found in the right context.
How to Spot It:
- Location: Occurs at the bottom of a downtrend.
- Appearance: A small body at the top of the candle with a very long lower wick (at least two to three times the size of the body). There is usually little to no upper wick.
The Story Behind the Pattern:
The market was in a steady decline. Sellers pushed the price down significantly during the session, creating a new low. However, at that low point, a massive wave of buying pressure entered. The "Bulls" fought back so aggressively that they pushed the price all the way back up to close near the opening price.
Trading Tip: When you see a Hammer at a Major Support Level, it is a signal that the bears have "run out of gas." It is time to look for a long (Buy) entry.
2. The Bearish Engulfing (The Trend Killer)
If the Hammer is the hero of the bulls, the Bearish Engulfing is the favorite weapon of the bears. It is a dual-candle pattern that signals a sudden and violent shift in market sentiment.
How to Spot It:
- Location: Occurs at the top of an uptrend or at a major Resistance level.
- Appearance: The first candle is a small green (bullish) candle. The second candle is a large red (bearish) candle that completely "swallows" or engulfs the body of the first candle.
The Story Behind the Pattern:
The buyers were comfortably in control, as evidenced by the small green candle. However, the second candle opens higher but is immediately met with overwhelming selling pressure. The sellers push the price down so hard that it closes below the previous candle’s open. This represents a total "regime change" in the market.
Trading Tip: This pattern is incredibly effective on higher timeframes like the 4-Hour (H4) or Daily (D1). If the engulfing candle is significantly larger than the previous five or ten candles, the signal is even stronger. Review our Trading Conditions for execution details.
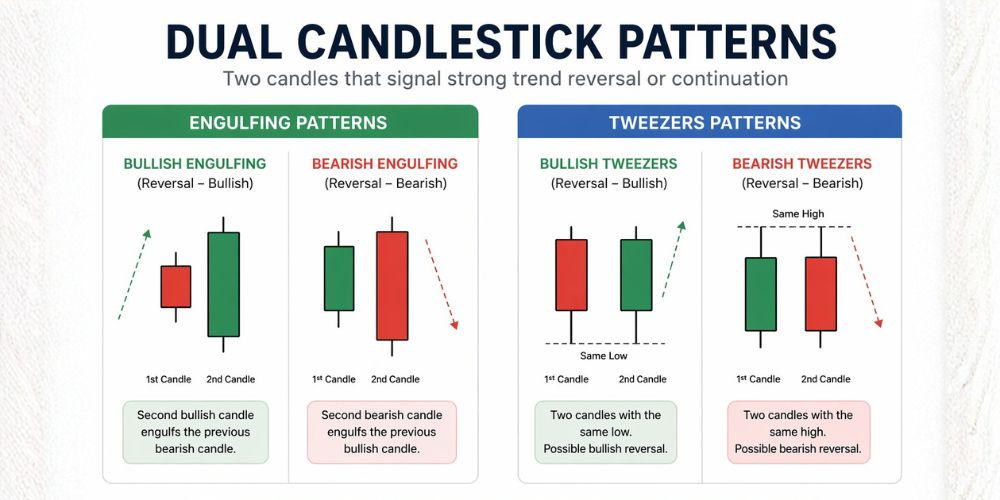
3. The Bullish Engulfing (The Momentum Starter)
The direct opposite of the Bearish Engulfing, this pattern is used to identify the exact moment a downtrend reverses into a new uptrend.
How to Spot It:
- Location: Occurs at the bottom of a downtrend or after a pullback in a healthy uptrend.
- Appearance: A small red (bearish) candle is followed by a large green (bullish) candle that completely engulfs the red candle.
The Story Behind the Pattern:
The bears thought they were in control, but the second candle shows that the bulls have arrived in force. By closing above the open of the previous bearish candle, the bulls have effectively "erased" the previous session's progress.
Trading Tip: For a higher probability of success, look for the Bullish Engulfing to occur right after the price has touched a "round number" (like 1.1000 in Forex) or a moving average. Check our Specifications for more on pairs.
4. The Morning Star (The Three-Day Reversal)
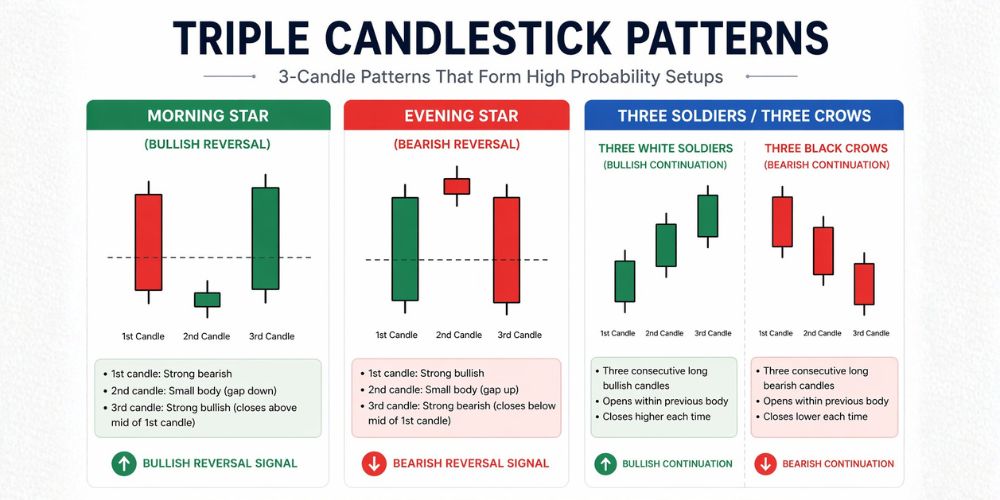
The Morning Star is a three-candle pattern. Because it takes more time to form, it is considered much more reliable than single-candle patterns. It represents the "dawn" of a new bullish move.
How to Spot It:
- Candle 1: A long red (bearish) candle, continuing the downtrend.
- Candle 2: A small-bodied candle (or a Doji) that gaps or stays below the first candle. This shows indecision.
- Candle 3: A long green (bullish) candle that closes well into the body of the first candle.
The Story Behind the Pattern:
The first candle shows the bears are in charge. The second candle shows that the bears are losing their grip and the market is confused. The third candle confirms that the bulls have won the battle.
Trading Tip: The Morning Star is a "conservative" trader’s favorite. It provides more confirmation than a Hammer because the third candle proves that buying momentum has actually returned. You can track these setups on our Economic Calendar.
5. The Shooting Star (The Rejection at the Top)
The Shooting Star is a bearish reversal pattern that looks exactly like an inverted Hammer. It is a warning sign that the "ceiling" has been reached.
How to Spot It:
- Location: Occurs at the top of an uptrend.
- Appearance: A small body at the bottom of the candle with a very long upper wick. There is little to no lower wick.
The Story Behind the Pattern:
Buyers pushed the price to a new high, feeling confident. However, at that high price, sellers were waiting in ambush. They rejected the higher price so fiercely that the candle closed back near its opening. The long upper wick represents "rejected" territory.
Trading Tip: If you are currently in a "Long" (Buy) position and you see a Shooting Star form at a major Resistance level, it is often a wise idea to take your profits and move to the sidelines. Check current Trading Hours for market activity.
The Secret Ingredient: Confluence
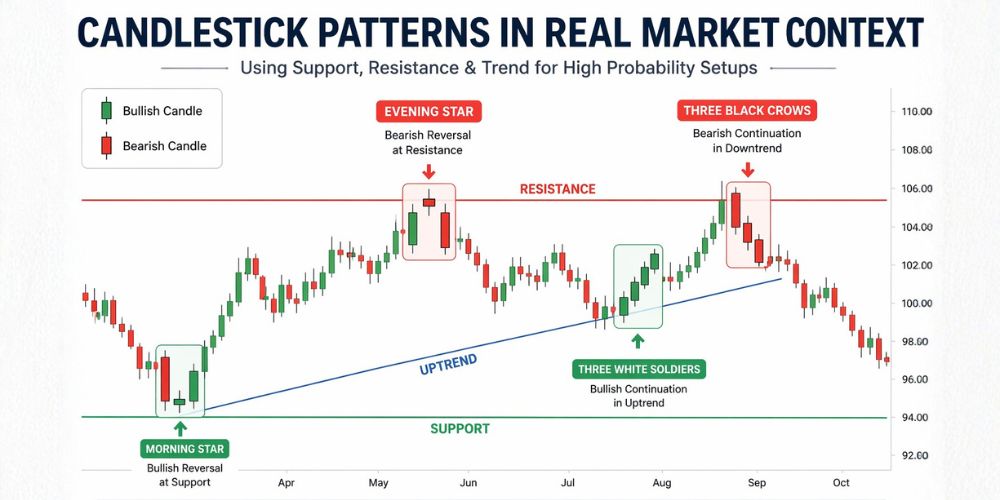
At Jaaz Markets, we always remind our traders: A pattern is only as good as its location. Imagine you see a perfect Bullish Engulfing pattern. Should you buy immediately?
- If it is floating in the middle of nowhere: No.
- If it is at a strong Support level, with a 200-day Moving Average beneath it and the RSI showing oversold: Yes!
This is called Confluence—where multiple technical tools point to the same conclusion. When you combine these "Big Five" patterns with Support and Resistance, you aren't just guessing; you are making high-probability decisions based on market data. Use our Calculators to manage your risk.
Recommended Reading for Deeper Insights:
- Beginner's Guide to Technical Analysis & Price Action
- Support and Resistance Trading Guide with Examples
- Complete Guide to Candlestick Patterns in Trading
- RSI Indicator Trading Guide for Beginners
How to Practice These Patterns
- Start with the Daily Chart: Patterns on the Daily (D1) chart are much more reliable than those on the 1-minute or 5-minute charts.
- Use a Demo Account: Before risking real capital on Jaaz Markets, spend a week just hunting for these five patterns on a demo account.
- Keep a Trading Journal: Take a screenshot of every pattern you trade. Did it work? If not, was it because there was no Support/Resistance nearby?
Final Thoughts
Trading is about simplicity. Many traders fail because they clutter their charts with too many indicators and complicated theories. By focusing on the Hammer, Bearish Engulfing, Bullish Engulfing, Morning Star and Shooting Star, you are focusing on the core of price action. Refer to our Glossary if any terms are unfamiliar.
These patterns have worked for decades because human psychology never changes. Fear and greed will always create these shapes on the charts. Your job is simply to recognize them and act with discipline. Review our Risk Disclosure to understand all aspects of trading.
Are you ready to see these patterns in action? Open your Jaaz Markets terminal today and see if you can spot a Morning Star forming on your favorite pair! Explore our Web Trader or Mobile App for real-time data.
👉 Start Learning more at our Academy or contact us via our Contact Page if you have questions.